BalticSatApps Success Stories: VesiVahti
BalticSatApps has since 2017 increased awareness about the data provided by the European Copernicus Programme, improved access to the data, and stimulated demand and innovation through co-creation and iterative development methodologies. Project has also developed Acceleration Programs focusing on Earth Observation business. Now it is time to let the project initiated teams to tell about their solutions to be real commercial products. The first BalticSatApps Success Story comes from Finland — Robert Talling will introduce his solution called VesiVahti.

“I always look for opportunities to create tools that help people in their life and work.”
I participated in the WeSeaChallenge for Sustainable Aquaculture in autumn 2019. The challenge assignment was given by the Nordic Trout Ab and the Suomen Kalankasvattajaliitto ry. The task was to develop a tool to monitor and assess the water quality for aquaculture farms in the Baltic Sea.
I have studied Computer Science at the Åbo Akademi, with a focus on software development. I have participated in many hackathons, because I like challenges. I always look for opportunities to create tools that help people in their life and work. I participated in the WeSeaChallenge because I am interested to learn, how satellite data can be processed and utilized in new applications.
VesiVahti was developed to measure and monitor water quality indicators in Baltic Sea
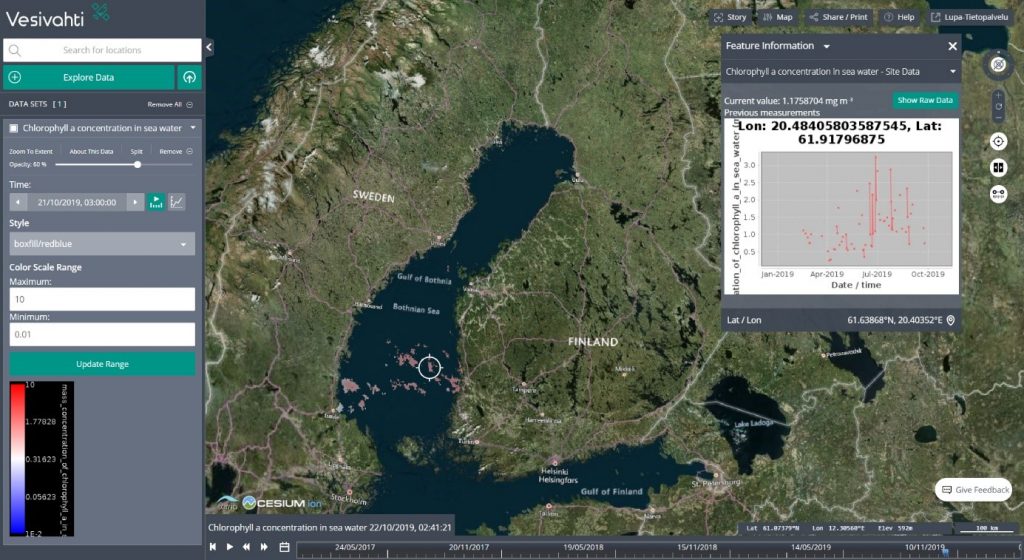
During the challenge I developed a simple web application which I named VesiVahti:
- With this application the user can measure and monitor the water quality indicators in the Baltic Sea. The water quality indicators are certain chemical substances like Chlorophyll A and others
- The measurements are calculated by using satellite data. Satellites can take measurements nearly in real time of any location in the world
- Expensive water quality sensors are not needed to be installed close to the aquaculture sites
- With VesiVahti, which is using continuous satellite measurements, the user can compare the water quality trends and forecasts over time.
Applied satellite data
The data sources I used were: Raw satellite images, Water quality indicator forecasts provided by the Copernicus Programme, and NOAA weather data. I additionally gathered a dataset of water emission thresholds and limits for each Finnish aquaculture farm by extracting this information from the Aluehallintavirasto Vesilupa reports (freely available online).
How is VesiVahti doing after WeSeaChallenge and what are the future plans?
Currently I am participating in the SpaceUp Accelerator Program to continue the development of VesiVahti. My aim is to integrate more data sources into the application and to improve the user experience. This program will give me the opportunity to find the potential pilot users for the application and to get user feedback.
It is great that programs like WeSeaChallenge are organized. This has been an excellent opportunity for me to get familiar with satellite data. Working with real-world challenges and use cases is very rewarding. In my opinion there is a lot of free data sources available, provided by different organizations and the government that could be utilized more for new innovative applications. I hope programs like this are organized also in the future, spreading the awareness of these great data sources and tools.
Robert Talling
Contact and inquiries about VesiVahti: robert(at)renotech.fi
The WeSeaChallenge was organised by the Turku Business Region, the University of Turku, and the Finnish Meteorological Institute as part of the BalticSatApps project (Interreg Baltic Sea Region Programme 2014–2020).


